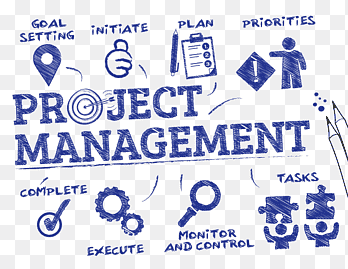
PROJECT MANAGEMENT
Project management is the process of leading the work of a team to achieve goals and meet success criteria at a specified time.
This free online project management course teaches the methods of project planning, scheduling, and controlling. The course consists of tutorials which cover the material of a typical introductory project management course at the Entry level.
Bar / Gantt Charts
1. How to draw a Gantt chart
2. How to draw a Gantt chart with more complicated predecessors
3. Advantages and disadvantages of Gantt charts
Precedence Diagram Method (PDM Network Diagram)
4. How to draw a PDM network diagram
5. Construct a PDM network diagram when given a table of dependencies
6. Construct a table of dependencies when given a PDM network diagram
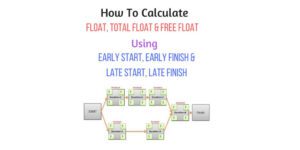
7. Determine Early Start (ES) and Early Finish (EF) of activities in a network diagram
8. Determine Late Start (LS) and Late Finish (LF) of activities in a network diagram
9. Use forward and backward pass to determine project duration and critical path
Critical Path Method (CPM Network Diagram)
10. Introduction to CPM network diagrams
11. How to draw a CPM Network Diagram
12. CPM vs. PDM Network Diagram example
Float / Slack in Network Diagrams
13. What is Total Float (Total Slack) and how to calculate it in a network diagram
14. What is Free Float (Free Slack) and how to calculate it in a network diagram
15. Determine total float and free float (aka “slack”) of activities in a network diagram
Lead / Lag in Network Diagrams
16. Lead & Lag in network diagrams explained
17. Logical relationships in network diagrams illustrated
18. Finish to Start (FS) network diagram example with lag
19. Start to Start (SS) network diagram example with lag
20. Finish to Finish (FF) network diagram example with lag
21. Start to Finish (SF) network diagram example with lag
22. Difficult network diagram example with lag solved
Work Breakdown Structure (WBS)
23. What is a work breakdown structure?
24. Introduction to PMI numbering system
Resource Constraining & Project Crashing
25. Resource histogram explained
26. Resource constraining example with resource histogram
27. Project crashing explained
Project Tracking & Control
30. How to draw project S-curve for cumulative costs
31. How to draw project S-curve for % complete
32. Compare baseline S-curves for Early Start and Late Start
Earned Value Analysis
33. Earned Value Analysis explained
34. Cost performance index (CPI) and cost variance (CV) explained
35. Schedule performance index (SPI) and schedule variance (SV) explained
36. Earned Value Analysis worked example
37. How to interpret an earned value graph
38. How to make predictions using earned value analysis