A gantt chart comes in handy when your project requires more planning than a basic to-do list. This guide will give you the basics of what you’ll need to create a gantt chart, no matter what platform you choose.
How to draw a Gantt chart tutorial
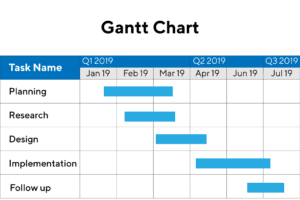
How to draw a Gantt chart
A Gantt chart, commonly used in project management, is one of the most popular and useful ways of showing activities (tasks or events) displayed against time. On the left of the chart is a list of the activities and along the top is a suitable time scale. Each activity is represented by a bar; the position and length of the bar reflects the start date, duration and end date of the activity. This allows you to see at a glance:
What the various activities are
When each activity begins and ends
How long each activity is scheduled to last
Where activities overlap with other activities, and by how much


 0
0