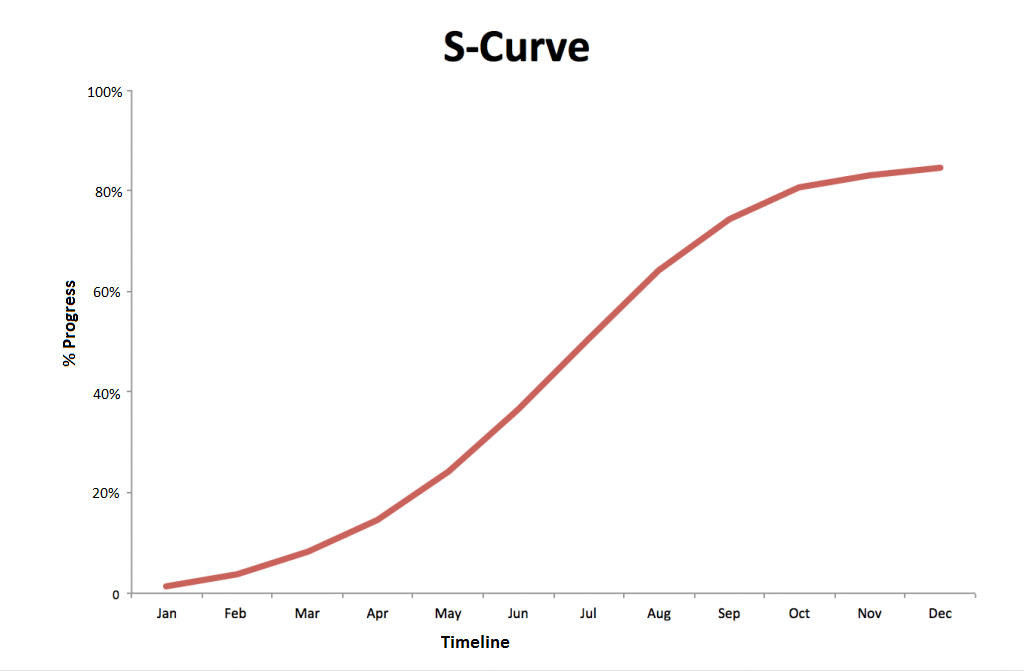
In project management terms, an s–curve is a mathematical graph that depicts relevant cumulative data for a project—such as cost or man-hours—plotted against time. … In today’s fast-paced business climate, ensuring that a project is on schedule and on budget is paramount to its success.
One thought on “Draw project S curve for cumulative costs”
Hi! Ӏ’ve been following your web site for a while now
and finally ɡot the courage to ցo aheaⅾ and give you a shout out fгom Kingwood Tx!
Just wanted to tell you keep up the great job!

 0
0


Hi! Ӏ’ve been following your web site for a while now
and finally ɡot the courage to ցo aheaⅾ and give you a shout out fгom Kingwood Tx!
Just wanted to tell you keep up the great job!